Academic performance questionnaire for students, with a Likert scale
A good academic performance questionnaire asks for the grade first, then about the habits and beliefs that travel with it. This one opens with a core 12 built on the factors most closely tied to grades in the research, adds a six-item Likert scale, and runs online, on paper or as a live poll.
- 34questions
- 12in the core
- 6 minfor the core
- Grade 9to university
By Michael Hodge, BSc Psychology Updated September 2026
All 34 academic performance questions
Questions 1 to 12 start selected. Tick a set for each factor your study tests; each question shows its options and what its answer adds to the analysis.
The core 12: grades and what drives them12 questions
Question 1 is the outcome. The rest measure attendance, study time, the grade a student aims for and six factors with published links to grades. Together they make a complete study on their own.
-
What were most of your grades in the term that just ended?
Mostly A'sA's and B'sMostly B'sB's and C'sC's or lowerYour outcome measure. Swap the bands for your own grading scale (percentages, 1.0 to 5.0) before you send it.
-
Compared with the term before, those grades were:
Much lowerA little lowerAbout the sameA little higherMuch higherDirection of travel. It separates a student who is slipping from one who is climbing at the same grade.
-
What average are you aiming for this term, at the very least?
Mostly A'sA's and B'sMostly B'sB's and C'sC's or lowerThe grade goal. Set it beside question 1: the gap between aim and result is often the most useful number in the study.2
-
How many of your classes did you miss over the past four weeks?
None1 or 23 to 56 to 10More than 10Attendance as a count, not a feeling. Absences have one of the strongest known links to college grades.5
-
Outside lessons, how many hours of study do you put in each week?
Under 22 to 56 to 1011 to 15More than 15Study time in bands students can estimate. Compare it with question 1 rather than reading it alone.
-
I can reach the grade I am aiming for this term.
Strongly disagree12345Strongly agree1 = Strongly disagree, 5 = Strongly agreeBelief in reaching a set grade. In university studies it tracks grades more closely than any other factor.2
-
When a subject gets hard or dull, I keep going until the work is done.
Strongly disagree12345Strongly agree1 = Strongly disagree, 5 = Strongly agreeEffort that holds up under boredom, the self-regulation factor with the clearest link to grades.
-
I start revising for a test several days before it.
Strongly disagree12345Strongly agree1 = Strongly disagree, 5 = Strongly agreePlanning ahead. A low score here next to low grades points to cramming rather than ability.
-
If I fall behind in a subject, I ask for help within a week.
Strongly disagree12345Strongly agree1 = Strongly disagree, 5 = Strongly agreeHelp seeking, timed. Students who wait until the test usually disagree here.
-
I have a quiet place to do schoolwork at home.
Strongly disagree12345Strongly agree1 = Strongly disagree, 5 = Strongly agreeThe home setting, one of the most common factors in student theses. Read it by grade band, not on its own.
-
I stay calm enough in tests to show what I know.
Strongly disagree12345Strongly agree1 = Strongly disagree, 5 = Strongly agreeTest nerves, worded so that agreeing is the good answer. Low scores with decent study time point to exam stress.
-
What helps or hurts your grades most right now?
Open answerThe factor you did not think to ask about. Code the answers into themes and count them.
Perceived performance scale (Likert)6 questions
Six agree statements about how students judge their own results. Sum them for a total between 6 and 30, or divide by six for an average on the 1 to 5 scale.
-
My grades this term reflect what I am capable of.
Strongly disagree12345Strongly agree1 = Strongly disagree, 5 = Strongly agreeWhether students see their results as a fair picture of their ability.
-
I hand in my assignments complete and on time.
Strongly disagree12345Strongly agree1 = Strongly disagree, 5 = Strongly agreeThe most concrete item in the scale, and the easiest to check against records.
-
I understand most of what is taught in my classes.
Strongly disagree12345Strongly agree1 = Strongly disagree, 5 = Strongly agreeUnderstanding, which can run ahead of or behind the grade.
-
My test scores match the effort I put in.
Strongly disagree12345Strongly agree1 = Strongly disagree, 5 = Strongly agreeA low score here often means study time is going into the wrong methods.
-
I do as well as most students in my classes.
Strongly disagree12345Strongly agree1 = Strongly disagree, 5 = Strongly agreeA comparison with classmates, which students make whether you ask or not.
-
I am satisfied with my academic results this term.
Strongly disagree12345Strongly agree1 = Strongly disagree, 5 = Strongly agreeSatisfaction, one of the six parts of academic success in the wider definition.1
In class and after it4 questions
Study behaviours for a thesis that tests habits against grades. Each asks for a frequency or a count.
-
After a lesson, how often do you reread or rewrite your notes from it?
NeverRarelySometimesOftenAlwaysReview between lessons, the habit most students skip until the week of a test.
-
How often do you speak up in class discussions?
NeverRarelySometimesOftenAlwaysParticipation. Useful where part of the grade depends on it.
-
On a school night, how long are you on your phone for fun?
Under 1 hour1 up to 2 hours2 up to 4 hours4 hours or moreLeisure phone time as a band, the usual measure when the thesis is about social media and grades.
-
What do you use to study?
NotesTextbookPractice testsVideosStudy groupAI toolsTick all that applyThe mix of methods. Practice tests next to higher grades is a finding worth reporting.
Home, health and work5 questions
Background factors outside school. Add them when your study looks at sleep, paid work, the trip to school or support at home.
-
On school nights, how many hours do you usually sleep?
Under 6About 6About 7About 89 or moreSleep in bands. Compare the lowest band with the rest.
-
How many hours a week do you work for pay?
None1 to 1011 to 20More than 20Working students. The top band is the group to look at first.
-
How long is your trip to school, one way?
Under 15 min15 to 30 min31 to 60 minOver an hourTravel time eats into study and sleep, especially in cities.
-
Can you get online at home when you need to for school?
AlwaysUsuallySometimesRarely or neverAccess for online homework and research, still a gap for some students.
-
Someone at home asks how my studies are going.
Strongly disagree12345Strongly agree1 = Strongly disagree, 5 = Strongly agreeFamily interest, the form of home support students can report on.
Teachers and school3 questions
Three factors on the school side, for studies that compare what students do with what they are given.
-
Before we start a task, I know what earns a good grade on it.
Strongly disagree12345Strongly agree1 = Strongly disagree, 5 = Strongly agreeClear criteria. Students who cannot see the target cannot aim for it.
-
My marked work comes back with notes on what to fix.
Strongly disagree12345Strongly agree1 = Strongly disagree, 5 = Strongly agreeFeedback that is usable, not just a mark.
-
The workload across my subjects is manageable.
Strongly disagree12345Strongly agree1 = Strongly disagree, 5 = Strongly agreeLoad across all subjects, which no single teacher sees.
About you4 questions
For comparing groups in the analysis. Compare groups only if each holds enough respondents that nobody can be identified.
-
Which year of school or college are you in?
Grade 9 or 10Grade 11 or 12College year 1 or 2College year 3+Grade level, the most common comparison in student theses.
-
How old are you?
Under 1616 to 1718 to 2021 to 2425 or olderAge bands, useful when one level mixes ages.
-
What is your gender?
FemaleMaleAnother genderPrefer not to sayOnly if your research question compares groups by gender.
-
What course, strand or major are you in?
Open answerLets you compare programmes. Group the answers before you count them.
Grades, self-reports or a scale: pick your measure
Academic performance can mean a grade on a transcript, a grade a student tells you, or how a student rates their own work. They are three different measures, so choose before you write the rest.
| Measure | Use it when | Keep in mind |
|---|---|---|
| Grades from school records | You have consent and the school will release them | Strongest evidence at a thesis defense; takes approval and time |
| Self-reported grades (question 1) | The survey is anonymous | Close to records on average; less so among low scorers |
| Perceived performance scale (questions 13 to 18) | Your question is how students judge their own work | A belief, so report it next to the grade, not in place of it |
Self-reported grades hold up well. Across 37 samples, they correlated .90 with records for college students and .82 for high school students.4 Accuracy drops among students with lower grades,3 and over-reporting was three to four times as common as under-reporting.4
Grades are also what most studies use. A review of how researchers define academic success found grades and GPA were the most common measure, inside a wider definition that adds learning objectives, skills, satisfaction, persistence and what students go on to do after college.1
For a class period without phones: the paper questionnaire
Paper suits a class period, a school that limits phones, or a sample reached through teachers. The files are sized to print on letter or A4.
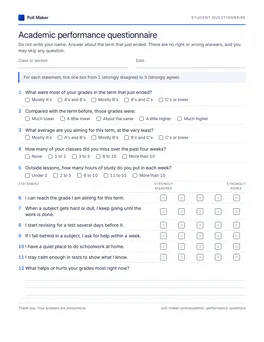
Student questionnaire
The first sheet lays out questions 1 to 12 as tick boxes; each optional set follows on later sheets, numbered on from question 13.
Download PDF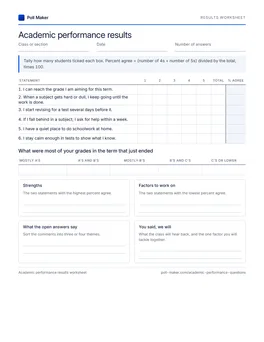
Results worksheet
Tally the six factor statements and the grade bands from the paper copies, then pick two factors to act on.
Download PDFThree published academic performance scales, compared
Advisers often ask for a named, validated scale. These three turn up in most thesis PDFs, and each one measures something different. None of them asks for a grade.
| Scale | Items and answers | What it measures |
|---|---|---|
| Academic Performance Scale (Birchmeier and colleagues, Saginaw Valley State University) | 8 items, 5-point agree scale, reliability .89 | Behaviour as a student; totals of 33 to 40 read as excellent6 |
| Perceived Academic Performance Scale (Verner-Filion and Vallerand, 2016) | 5 items, 1 (do not agree at all) to 7 (very strongly agree) | Whether students feel they meet what is expected of them7 |
| Pham and Taylor (1999) questionnaire | 48 items, 5-point scale | Self-efficacy, emotional effects, planning, lack of outcome control and motivation8 |
Their items are not reproduced here. The perceived performance set on this page is original wording, written to sit beside a grade question. If you choose a published scale instead, cite it and take the items from its authors or the database that holds it.
Design choices your chapter four will depend on
Four decisions decide whether the answers can carry a finding in chapter four.
How closely each factor tracks university GPA (correlation r)
Build the core on the strongest predictors
A review of 241 data sets on university grades ranked 50 possible factors. A student's belief that they can reach a set grade came out strongest (r = .59), followed by earlier grades, the grade they aim for (.35) and effort that holds up when work is dull (.32). Demographic and background factors showed small links at best.2 Questions 3, 6 and 7 ask about those three factors directly. Question 4 covers attendance, which predicts college grades better than admissions test scores do.5

Put the grade question first, in your own bands
Question 1 is the outcome, so students answer it before anything else colours their view. Change the bands to match your grading, whether that is letters, percentages or a 1.0 to 5.0 scale, and ask about one term so every answer covers the same period. If the school will release records with consent, link them to responses by a code number rather than a name.

Send it in the week results come out
Right after report cards, the grade is fresh and the habit questions describe the same term the grade came from. Wait a month and a new term, new classes and new habits blur both.
Clear consent before the first response
For students under 18, most schools want written approval and a letter to parents before a survey goes out. Start the form with a short purpose statement, a promise that it asks for no names, and a note that every question is optional. Then trial it on three or four students who are not in your sample and fix whatever confuses them.
Curious about one habit ahead of the full questionnaire? Project the study hours question as a quick live poll; everyone answers from their seat in seconds. For links, QR codes and embeds, see sharing a poll.
Pressed for time: grade, goal, absences and two beliefs
The smallest version worth running: the grade, the goal, absences, belief in reaching the goal, and keeping at work that gets dull. The last four match factors with some of the strongest published links to grades.
- 01What were most of your grades in the term that just ended?
- 02What average are you aiming for this term, at the very least?
- 03How many of your classes did you miss over the past four weeks?
- 04I can reach the grade I am aiming for this term.
- 05When a subject gets hard or dull, I keep going until the work is done.
From questions to variables, with a worked example
Most academic performance studies test one idea: that a factor goes with better grades. This is how the questionnaire splits into variables for that test.
| Variable | Questions | Analyse with |
|---|---|---|
| Academic performance (outcome) | 1, plus the 13 to 18 score if you use it | Counts per grade band; the score as a mean |
| Factors (predictors) | 3 to 11, plus any optional set | Agree (4 or 5) against the rest, or the bands as they are |
| Background | About you | Group comparisons, only for groups big enough to stay anonymous |
Example numbers, to show the method: 80 students answer. On question 6, 50 agree that they can reach their target grade and 30 do not. Of the 50, 31 report mostly A's or A's and B's; of the 30, 8 do. That is 62 against 27 in every hundred, a gap you can check against chance with chi-square on the two-by-two table. To use all five grade bands at once, run Spearman's rank correlation between question 6 and question 1.
Correlation is the honest claim for a one-off survey. Say that the factor goes with higher grades, not that it causes them.
Find the factor to work on first
Key in the tallies for the six factor statements, from strongly disagree through strongly agree. The chart ranks them, flags the two weakest, and prints as one page for a class meeting or a thesis appendix.
- 1For each statement the tool counts the 4s and 5s and divides by every answer to that statement.
- 2Take the two weakest statements back to the grade question. If the students who disagree are also the ones with lower grades, that factor is your focus.
- 3Look at absences and study hours next. A weak statement alongside frequent absences points to attendance before anything else.
- 4Show the class the chart and name the one factor you will work on together this term.
Factor results
Academic performance questions to reword
Three items that turn up in student questionnaires again and again, each with a sharper version. The survey question types guide has more worked examples.
How is your academic performance?
What were most of your grades in the term that just ended?
Students read "performance" in different ways. A grade band gives one answer you can compare across the whole sample.
Do you study hard and attend all your classes?
Outside lessons, how many hours of study do you put in each week?
How many of your classes did you miss over the past four weeks?
Two behaviours in one item, and "hard" means something different to each student. Ask for a count, one behaviour at a time.
Does social media lower your grades?
On a school night, how long are you on your phone for fun?
What were most of your grades in the term that just ended?
No student can see cause and effect in their own life. Ask for the habit and the grade separately, then test the link in the analysis.
Academic performance questionnaire FAQ
What student researchers and their advisers ask most.
How do you measure academic performance in a questionnaire?
Ask for the grade first, in bands that match your school's grading, then ask about the factors you want to test. Use records instead of self-reports when you have consent, and add a perceived performance scale only when your question is about how students judge themselves.
Is there a Likert scale for academic performance?
Yes. Questions 13 to 18 form a six-item agree scale scored from 6 to 30. Published options include an eight-item scale from Saginaw Valley State University and a five-item perceived performance scale; the comparison table on this page sets out what each one measures.
What factors affect academic performance the most?
In a meta-analysis of university grades, the strongest link was a student's belief that they can reach a set grade, followed by earlier grades, the grade they aim for and sustained effort.2 Class attendance predicts college grades better than admissions tests.5
Can I use self-reported grades in a thesis?
Usually, yes, as long as your limitations section says so. Self-reports track records closely on average, though students with lower grades report them less accurately.4 Bands are easier to answer honestly than an exact average.
How long should an academic performance questionnaire be?
Long enough to cover the outcome and each factor you test. The core 12 takes most students about six minutes, and all 34 questions about fifteen.
Send it to your sample this term
Everything above is one click from a working survey: the core 12 plus whichever sets you tick, ready to share with your sample. Collecting on paper? The PDF is ready to print.