IT survey questions for employees about what slows their work
An employee technology survey asks staff how well the information technology they rely on, from laptops and software to remote access and the IT help desk, lets them do their work. The core 12 takes staff around five minutes; add a set when one part of IT is under review.
- 38questions
- 12in the core
- 6optional sets
- 0 to 10overall IT rating
By Michael Hodge, BSc Psychology Updated September 2026
The core set plus help desk, device, access and training sets
Our core 12 starts selected and can run by itself. Add a set for whatever IT is changing next: the help desk, devices, remote access, sign-ins or training. Each row lists the exact answer choices, then what a weak result usually signals for IT.
The core 1212 questions
One overall 0 to 10 rating, eight statements covering equipment, software, access, calls and the help desk, then the weekly hours lost, the change staff would make first, and the workarounds they never report.
-
Overall, how would you rate the technology and IT support you get at work?
0123456789100 = Very poor, 10 = ExcellentThe headline number to track between rounds. Score it the way HappySignals scores its 0 to 10 happiness rating: the share of 9s and 10s minus the share of 0 to 6.1
-
My computer is fast enough for the work I do.
Strongly disagree12345Strongly agree1 = Strongly disagree, 5 = Strongly agreeEquipment speed as the person using it feels it. Cross it with the age of the machine in the equipment set to plan a refresh.
-
The software my job depends on works reliably.
Strongly disagree12345Strongly agree1 = Strongly disagree, 5 = Strongly agreeCrashes, freezes and slow screens in the applications people use all day. Read it by team to find which system to look at first.
-
I can reach my files and systems from any location.
Strongly disagree12345Strongly agree1 = Strongly disagree, 5 = Strongly agreeAccess for hybrid, remote and field staff. A gap between on-site and remote answers points to sign-in, VPN or permission problems.
-
Video calls and team chat work without trouble.
Strongly disagree12345Strongly agree1 = Strongly disagree, 5 = Strongly agreeCollaboration tools. A bad call wastes everyone's time at once, so small fixes here pay back across the whole meeting.
-
I know how to get help when technology stops me.
Strongly disagree12345Strongly agree1 = Strongly disagree, 5 = Strongly agreeKnowing who to contact. It was one of the more mixed reasons behind employees' overall view of IT in the HappySignals benchmark.1
-
IT responds quickly when I ask for help.
Strongly disagree12345Strongly agree1 = Strongly disagree, 5 = Strongly agreeSpeed. It was the reason employees named most often when explaining their rating after an IT incident, ahead of the attitude and skills of the person helping.1
-
IT staff explain things in words I understand.
Strongly disagree12345Strongly agree1 = Strongly disagree, 5 = Strongly agreeHow the help feels. In a study of 84 calls from employees to their help desk, caller-centered behavior in the first two minutes predicted how satisfied the caller was.3
-
Problems I report to IT stay fixed.
Strongly disagree12345Strongly agree1 = Strongly disagree, 5 = Strongly agreeFixes that last. A problem that returns costs the repair time again, plus any work that has to be redone.
-
In a typical week, how much work time do technology problems cost you, including redone work?
NoneUnder 30 minutes30 to 60 minutes1 to 3 hoursMore than 3 hoursLost time, redone work included. In a time-diary study, workers spent more time recovering lost work than solving the problem itself. The worked example further down turns these answers into hours.2
-
Which change would help your work the most?
A faster computerFewer sign-insQuicker IT helpBetter trainingEasier remote accessThe first fix, by vote. When the top answer points the same way as the lowest statement, you know where to start. It also runs as a live poll.
-
Which technology problem have you learned to work around instead of reporting?
Open answerThe problems that never reach the help desk. Workers in the time-diary study mostly rebooted, redid the task or found a way around it; a manual was opened once in 149 incidents.2
After a support request6 questions
Send these six when a ticket closes, not with the yearly survey. They show what the wait felt like while the details are fresh.
-
How did you contact IT this time?
Portal or formEmailPhoneChatIn personThe channel. In the HappySignals data, walk-in help scored best and the portal worst on both happiness and lost time, so compare your own channels before steering everyone to one.1
-
How many people or teams handled it before it was fixed?
OneTwoThreeFour or moreNot fixed yetHandoffs. Across 889,164 incident responses, a first-time fix came with about 2 hours 7 minutes of perceived lost time; two handoffs raised that to 5 hours 47 minutes.1
-
I was kept up to date while I waited.
Strongly disagree12345Strongly agree1 = Strongly disagree, 5 = Strongly agreeUpdates during the wait. Slow responses and late acknowledgement were among the most common themes in employees' comments about incidents.1
-
IT understood my problem quickly.
Strongly disagree12345Strongly agree1 = Strongly disagree, 5 = Strongly agreeEarly understanding. The opening minutes of a support call predicted caller satisfaction in the help desk study, so this is where coaching pays off.3
-
About how much work time did this problem cost you?
Under 15 minutes15 to 60 minutes1 to 4 hoursHalf a day or moreLost time for one request. HappySignals reports it next to happiness because a friendly, well-handled ticket can still cost hours.1
-
What one thing would have made this request easier?
Open answerProcess fixes in the requester's words: a shorter form, one owner, a status message, a callback.
Computers, phones and equipment5 questions
Add these before a hardware refresh, so spending lands on the machines and teams that need it most.
-
Which device do you do most of your work on?
Company laptopCompany desktopMy own computerPhone or tabletShared computerLets you read the other device answers by type. Laptop, desktop and shared-computer users usually need different fixes.
-
How old is the computer you use most?
Under 1 year1 to 2 years3 to 4 years5 years or moreNot sureRefresh planning. Set it beside the speed statement in the core to see where older machines hold people up.
-
My headset and camera work well on calls.
Strongly disagree12345Strongly agree1 = Strongly disagree, 5 = Strongly agreeCall gear is cheap to replace and used all day. A low score here often sits behind a low score for video calls.
-
A broken device gets replaced quickly.
Strongly disagree12345Strongly agree1 = Strongly disagree, 5 = Strongly agreeRepair and swap time. Spare stock and courier times show up here, not in help desk response times.
-
My work phone does everything my job needs.
Strongly disagree12345Strongly agree1 = Strongly disagree, 5 = Strongly agreeMobile devices were the lowest-rated of nine IT touchpoints in the HappySignals benchmark for 2025. Ask this only where the company issues phones.1
Working from home or on the road4 questions
For hybrid, remote and field staff. Compare their answers with people on site to find the gaps in access and remote help.
-
Where do you do most of your work?
On site every dayMostly on siteHalf and halfMostly remoteFully remoteThe split for reading the access, call and remote help answers.
-
What slows you down when you work away from the office?
VPN or sign-inHome internetOne screen onlyFiles out of reachPrintingNothingTick all that applyA shopping list for the remote kit and the network team. Count "Nothing" too: it tells you what already works.
-
My tools work as well at home as on site.
Strongly disagree12345Strongly agree1 = Strongly disagree, 5 = Strongly agreeParity between locations. Remote work was among the highest-rated IT touchpoints in the 2025 benchmark, so a low score here stands out.1
-
Remote help from IT works as well as help in person.
Strongly disagree12345Strongly agree1 = Strongly disagree, 5 = Strongly agreeRemote support. If it trails in-person help, look at screen sharing and whether technicians can see what the employee sees.
Sign-ins and security steps4 questions
Security as employees live it: how many passwords, how much the checks get in the way, and whether they know how to report a bad email.
-
How many passwords do you use for work?
One2 to 34 to 67 or moreNot sureSign-in sprawl. A high count makes the case for single sign-on, and every password is one more thing to reset.
-
Extra sign-in checks rarely get in my way.
Strongly disagree12345Strongly agree1 = Strongly disagree, 5 = Strongly agreeFriction from codes, prompts and timeouts. When security steps feel slow, people look for ways around them.
-
I know how to report a suspicious email.
Strongly disagree12345Strongly agree1 = Strongly disagree, 5 = Strongly agreeThe reporting route. If this is low, make the report button easier to find before the next phishing test.
-
Our rules for using technology at work are clear.
Strongly disagree12345Strongly agree1 = Strongly disagree, 5 = Strongly agreePolicies were the second biggest reason behind employees' overall view of IT in the benchmark, after support itself.1
Training and new tools4 questions
Add these ahead of a rollout. The answers tell you which format to plan and which tools people want to get better at.
-
How do you like to learn a new work tool?
VideosLive classA colleagueWritten guideOn my ownTick all that applyThe format to plan for, team by team, before the next rollout.
-
I was trained before the last new tool went live.
Strongly disagree12345Strongly agree1 = Strongly disagree, 5 = Strongly agreeTiming. Training was the third biggest driver of overall IT experience in the benchmark, after support and policies.1
-
People like me are asked before new tools are chosen.
Strongly disagree12345Strongly agree1 = Strongly disagree, 5 = Strongly agreeA voice before purchase. A pilot group with someone from each team is the usual fix when this is low.
-
Which tool would you like to be better at using?
Open answerA training list in staff words. Count the tools named more than once in each team.
About you (optional)3 questions
Team, contact with IT and support style give you the splits to read results by. Report no group smaller than ten people.
-
Which part of the organization do you work in?
Sales and serviceOperationsFinance and adminTechnicalOtherTeam results. The federal IT survey hides any figure based on fewer than ten answers; do the same and merge small teams into a neighbor.4
-
How many times have you asked IT for help in the last year?
NeverOnce or twice3 to 5 times6 times or moreSeparates people who have used IT support from those who have not. Read the help desk statements in the core only for people who have asked, as the federal survey does with its screening question.4
-
When something stops working, what do you usually do first?
Fix it myselfTry, then askAsk right awayWait for helpSupport style. HappySignals describes self-reliant Doers as highly sensitive to delay, so read the speed statement by this answer.1
Match a set to what IT is changing next
The core 12 suits a yearly all-staff survey, and the sets go deeper when one part of IT is under review. The after-ticket set works differently: send it as each request closes and keep its scores apart from the yearly ones, because answers given the moment a problem is solved tend to run higher than answers given months later.1
| When | Add this set | What you learn |
|---|---|---|
| Reviewing the help desk or its contract | After a support request | Channel, handoffs and lost time per ticket |
| Planning a laptop or phone refresh | Computers, phones and equipment | Which machines and teams to replace first |
| Hybrid, remote or field teams | Working from home or on the road | Where remote access and remote help fall short |
| New sign-in rules or a phishing test | Sign-ins and security steps | Password load and how much the checks slow people |
| A new system is on its way | Training and new tools | The training format each team prefers |
| Comparing teams or sites | About you | Results by team, contact with IT and support style |
Rolling out one particular system? Measure that tool on its own with the technology acceptance questionnaire before launch, then with post implementation review questions once it is live.
Lessons from published IT experience data
Four practices drawn from published IT experience data, each tied to questions in the set.
Reasons employees gave for their rating after an IT incident
The wait and the helper count as much as the fix
HappySignals asks employees to pick the reasons behind their rating after each IT incident. Of 1,522,364 reasons picked in 2025, speed of support took 29.2%, the attitude of the person helping 20.5% and their skills 19.0%, while solving the ticket took 6.6%.1 A fix is expected; what people remember is how fast and how well they were helped. So the core puts response speed, clear explanations and lasting fixes in separate statements.

Find the problems nobody reports
In a time-diary study of 50 workplace computer users, people lost 42 to 43% of their computer time to frustrating experiences. They mostly rebooted, redid the task or worked around the problem; across 149 incidents a manual was opened once and online help twice.2 Problems like these never become tickets, so help desk data cannot see them. The core's closing open question asks for exactly these, and the lost-time question sizes them.
Run a yearly survey and an after-ticket check
The two jobs need two instruments. The yearly survey reaches everyone, including people who never call IT. The after-ticket set goes out automatically when a request closes; HappySignals collects its incident scores this way and reports about 3 hours 18 minutes of perceived lost time per incident in 2025.1 Per-ticket numbers like that come from asking at the moment of resolution. Read the two side by side and never average them together.
Borrow three habits from the federal IT survey
Each year, employees at 24 US federal agencies rate IT support, collaboration tools and equipment; 273,438 surveys were completed in 2023.4 Three of its rules travel well. A first question on how often people used the service keeps non-users out of the support ratings, and the About you set carries one for the same job. Reminders go out weekly across a six-to-eight-week field period. And no result is shown for fewer than ten responses, which keeps small teams anonymous.
At an all-hands or a team meeting, ask the room which change would help most and show the votes as they arrive. Launch it on the homepage poll maker with the button below, then set the result beside the survey. For a first-time poll, the poll set-up guide covers posting the link in Teams or Slack and watching the votes come in.
An IT scorecard from the core statements
Copy your tallies for computer speed, software, access, calls, finding help, response speed, explanations and lasting fixes into the boxes. Disagreement sits on the left, agreement on the right, and the two lowest statements are marked as the first things IT should work on.
- 1Begin with the 0 to 10 rating: the percent of people answering 9 or 10, less the percent answering 0 through 6, is this round's headline.
- 2Then read the eight statements in pairs: computer and software, access and calls, finding help and speed, clear explanations and lasting fixes.
- 3Split every statement by team and by work location. A gap between on-site and remote staff usually points to access or remote support.
- 4Put the two lowest statements on the intranet next to the person fixing each and a target month, then repeat the core next year to see whether they rose.
Core IT statements
Put a number on lost time
The weekly lost-time question in the core becomes hours once each answer band gets one agreed value. Here is the arithmetic for 240 employees.
| Answer | Minutes counted per person | People (example) |
|---|---|---|
| None | 0 | 48 |
| Under 30 minutes | 15 | 84 |
| 30 to 60 minutes | 45 | 60 |
| 1 to 3 hours | 120 | 36 |
| More than 3 hours | 240 | 12 |
Multiply each row and add them up: 1,260 + 2,700 + 4,320 + 2,880 = 11,160 minutes, or 186 hours every week across the 240 people, a little under 47 minutes each. Over a 46-week working year that comes to about 8,560 hours.
Now split the same sum by team and by the fix-first vote. If most of the 12 people losing more than three hours sit in one team and vote for fewer sign-ins, single sign-on for that team's systems is the first project. Ask the question again three months after the fix, with the same bands, and the drop in weekly hours is your result.
Write the band values into your report and keep them the same every round. Lazar and colleagues counted two parts of every lost stretch, the minutes spent solving the problem and the minutes spent redoing lost work,2 so the core question asks people to count redone work too.
A quarterly pulse between yearly rounds
One full survey a year is plenty. In the quarters between, these five track the overall rating, response speed, repeat problems, lost time and the fix people want next. Keep the wording identical so each quarter can be read against the last.
- 01Overall, how would you rate the technology and IT support you get at work?
- 02IT responds quickly when I ask for help.
- 03Problems I report to IT stay fixed.
- 04In a typical week, how much work time do technology problems cost you, including redone work?
- 05Which change would help your work the most?
When the laptop is the problem, hand over paper
A broken or painfully slow computer is exactly when someone cannot open a survey link. Leave printed copies at the help desk counter, in break rooms and with shift supervisors, plus a sealed box for finished forms. The files suit US letter and A4 alike.
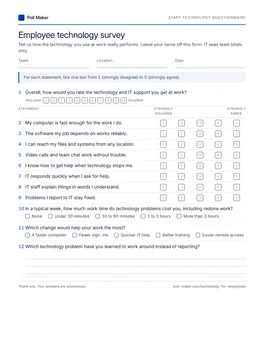
Staff IT questionnaire
Sheet one carries a 0 to 10 row, eight tick-box statements, the lost-time bands and the fix-first vote; later sheets hold the six optional sets, after-ticket questions first.
Download PDF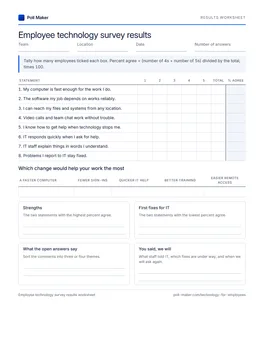
IT results tally sheet
Tally the eight statements from 1 to 5, count the fix-first vote, and write down the two lowest areas with an owner for each.
Download PDFHome-grown IT survey items, rewritten for action
Four items common on home-grown IT surveys, rewritten so every answer tells IT what to change. General wording rules sit in our survey questions guide.
Is IT support fast and helpful?
IT responds quickly when I ask for help.
IT staff explain things in words I understand.
Speed and helpfulness can move in opposite directions. Bundled into one question, a low score leaves the help desk guessing which to fix.
How would you rate our network infrastructure?
I can reach my files and systems from any location.
Employees cannot see infrastructure. They can say whether they reach what they need, which is what the infrastructure is for.
Do you experience technology issues?
In a typical week, how much work time do technology problems cost you, including redone work?
Nearly everybody answers yes to the vague version. Bands of lost time size the problem and show whether it shrinks after a fix.
How willing are you to adopt new software recommended by IT?
I was trained before the last new tool went live.
People like me are asked before new tools are chosen.
The old wording puts the burden on staff. The better pair asks what IT did to make the change easy to accept.
What IT and HR teams ask about staff tech surveys
For IT managers, service desk leads and HR teams planning the first round.
What questions should an IT survey for employees include?
Start with an overall 0 to 10 rating, then statements on what staff use every day: computer speed, software reliability, access from any location, calls and chat, knowing how to get help, response speed, clear explanations and fixes that last. Close with lost hours, a pick of the most wanted change, and an open prompt about workarounds.
How often should you survey employees about IT?
The full core yearly, a five-question check each quarter between rounds, and the after-ticket set whenever a request closes. Fixed wording lets every round sit beside the one before it.
Should an employee IT survey be anonymous?
Yes. People are more open about a slow laptop, a workaround or a curt technician when their name is off the form. Report a team only when it has at least ten answers, the threshold the federal IT survey uses.4
What is a good IT satisfaction score?
Compare yourself with your own last round first. For an outside reference, HappySignals turns its 0 to 10 rating into a single score by taking the percent of 9 or 10 answers and subtracting the percent of answers from 0 through 6, and its 2025 benchmark for overall IT experience was +50, up from +34 in 2022.1 Score the overall question in this set the same way for a rough comparison.
Can I use these questions for a research project on information technology at work?
Yes. The core statements share one agree scale, and the About you set gives you groups to compare. If your course asks for a published scale about one system, the End-User Computing Satisfaction instrument by Doll and Torkzadeh is the classic choice;5 cite it and take its wording from the original paper, since this page does not reproduce it.
Put the core 12 in front of every team
Load the survey into the builder, add your organization's name and any set IT is working on, and send the link from someone staff trust. Print copies for anyone whose computer is the problem.