Media consumption survey questions with answers you can count
A media survey works when it asks which channels people used, on how many days, for how long, on what screen and why. The core 10 covers exactly that in about three minutes, and every answer can be counted: days out of seven, time in even bands, and the one channel each person would keep.
- 34questions
- 10in the core set
- 3 minto answer the core
- 0 to 7days counted per channel
By Michael Hodge, BSc Psychology Updated September 2026
Channels, days, devices and ads: all 34 questions
The ten core questions come pre-ticked. Add a set for your project or pick single rows. Each row lists every answer option plus a line on what you learn from it, ready to send online, print or paste into a class assignment.
The core 10: channels, days and time10 questions
One tick list of channels, four questions that count days in the past week, then time, device, reason, the channel people would keep and one open question. Ten questions that stand alone as a full media consumption survey.
-
In the past 7 days, which of these did you use?
TV shows or filmsOnline videoRadioMusicPodcastsPrint news or magazinesNews sites or appsSocial mediaVideo gamesNone of theseTick all that applyThe whole media mix in one question. The fixed 7-day window stops people answering for a good week instead of a normal one.
-
In the past 7 days, on how many days did you watch TV shows or films, live or streamed?
01234567A count from 0 to 7 means the same thing to everyone, unlike "often". Five days or more marks a frequent viewer.1
-
In the past 7 days, on how many days did you watch videos on YouTube or a similar site?
01234567Free online video is a separate habit from shows and films. Keep it apart so the two can be compared, especially across age groups.
-
In the past 7 days, on how many days did you listen to radio, podcasts or audiobooks?
01234567Spoken audio, not music. It is the channel people reach in the car and on foot, which screen questions miss.
-
In the past 7 days, on how many days did you read, watch or listen to the news?
01234567News across every channel in one count. Surveys often overstate news habits, so a dated count keeps the answer grounded.4
-
On a typical day, how much time do you spend on media outside work or school?
Under 1 hour1 to under 3 hours3 to under 5 hours5 to under 7 hours7 hours or moreEven two-hour bands with an open top. The range of the bands shapes the answers, so keep them wide enough for heavy users.3
-
Which device do you use most for watching, listening and reading?
PhoneTV screenLaptop or computerTabletRadio, speaker or carTells a publisher or media planner which screen to design for first. Read it next to the age question if you add it.
-
What is the main reason you turn to media?
Relax or be entertainedKeep up with newsLearn somethingFeel connectedFill spare timeThe motive behind the minutes. Two groups with the same hours can want very different things from them.
-
If you could keep only one of these, which would you keep?
TV and streamingOnline videoMusic and radioPodcastsNews and readingA forced choice shows which channel people value most, which the day counts alone cannot. It also makes a good live poll.
-
What have you started or stopped watching, reading or listening to in the past year, and why?
Open answerChange in people's own words: a new service, a cancelled paper, a podcast habit. Sort the answers into a few themes.
TV, streaming and video6 questions
For broadcasters, streaming teams, student projects on viewing habits and anyone planning video content.
-
How do you watch TV shows and films most of the time?
Live on a TV channelOn a paid streaming serviceOn free online video sitesRecorded or downloadedI rarely watchThe split between live and on-demand viewing, which decides when and where a programme or ad gets seen.
-
Which kinds of shows or films do you watch most?
NewsSportDramaComedyRealityDocumentariesFilmsKids and familyTick all that applyGenre mix. Cross it with the viewing route above to see which kinds of shows people watch live and which on demand.
-
How do you usually find something new to watch?
Suggestions in the appFriends or familySocial mediaReviews or articlesTrailers or adsDiscovery route. If most people rely on app suggestions, promotion outside the app reaches fewer of them.
-
How many video streaming services does your household pay for?
None1234 or morePaid services in the home. A count is quicker to answer than a list of brands, and it stays valid when services change their names.
-
In the past 12 months, have you cancelled a streaming service?
Yes, to save moneyYes, I watched what I wantedYes, for another reasonNoChurn and its main cause. Read it next to the number of services the household pays for.
-
How often are you on your phone while you watch TV?
NeverRarelySometimesOftenAlwaysSecond-screen viewing. A show watched with a phone in hand gets part of the attention the minutes suggest.
Radio, music and podcasts5 questions
For radio stations, podcasters and researchers who want the listening half of the picture.
-
Where do you listen most?
At homeIn the carOn foot or public transportAt work or schoolWhile exercisingListening follows routines. The place tells you the moment of the day a spot or episode will be heard.
-
How do you mostly listen to music?
Free streaming with adsPaid streamingRadioMy own downloads or CDsI rarely listenSeparates ad-supported listeners from paying ones, which matters to anyone buying or selling audio ads.
-
How many podcast episodes did you listen to in the past 7 days?
01 to 23 to 56 to 10More than 10Episodes are easier to recall than minutes, and a zero here keeps non-listeners out of the next question.
-
Which podcast topics do you listen to?
News and politicsComedyTrue crimeBusinessSportLearningHealthI do not listen to podcastsTick all that applyTopic mix among listeners. Useful for a show choosing a niche or a brand choosing where to sponsor.
-
How do you usually find a new podcast?
App suggestionsFriends or familyMentioned on another podcastSocial mediaSearchShows whether new listeners arrive through apps, people or other shows, which decides where a podcast should promote itself.
News and trust5 questions
For newsrooms, libraries, civic groups and research projects on news habits.
-
Where do you get news most often?
TVNews websites or appsSocial mediaRadio or podcastsPrintFriends and familyThe main news route. Pair it with the core news-days question to see whether heavy news users lean on one channel.
-
Do you get news from national network TV, such as the ABC, CBS or NBC evening news?
Yes, most daysYes, now and thenNoNaming examples stops people counting cable news or a news app as network TV, a mix-up that inflates the answer.1
-
I trust most of the news from the sources I use.
Strongly disagree12345Strongly agree1 = Strongly disagree, 5 = Strongly agreeTrust in their own sources, which is steadier and more useful than trust in "the media" in general.
-
I sometimes avoid the news on purpose.
Strongly disagree12345Strongly agree1 = Strongly disagree, 5 = Strongly agreeDeliberate news avoidance. A group high here needs shorter, calmer formats rather than more alerts.
-
Do you pay for news, for example a newspaper, magazine or news app subscription?
Yes, printYes, digital onlyYes, print and digitalNoAsked with examples, because many people do not think of a subscription or a bundle when asked a bare "do you pay for news".2
For media planners: ads and timing5 questions
For marketers choosing channels and slots. Send the core first, then add these five.
-
At what time of day do you watch, listen or read most?
Early morningDaytimeEveningLate nightIt variesPeak time for your audience rather than the national average, which is what a schedule needs.
-
Where do you remember seeing or hearing an ad in the past 7 days?
TV or streamingRadio or podcastsSocial mediaWebsites or appsPrintBillboards or transportI do not remember anyTick all that applyUnprompted ad recall by channel. It shows where ads get noticed, not only where they run.
-
What do you usually do when an ad starts during a show or video?
Watch itSkip it when I canPick up my phoneMute it or step awayI pay to avoid adsAd avoidance in concrete actions. Useful for TV commercial research and for choosing ad length.
-
When a service offers a cheaper plan with ads, which do you choose?
The plan with adsThe plan without adsIt depends on the serviceI only use free servicesHow many of your audience sit on ad-supported tiers and can be reached there at all.
-
In the past 3 months, have you looked up a product after an ad on TV, radio or a podcast?
Yes, more than onceYes, onceNoA dated action rather than "do ads influence you", which most people answer no to whatever they do.
About you (optional)3 questions
Add these to split the results by age and household. Skip a split whenever one of its groups is tiny.
-
How old are you?
Under 1818 to 2930 to 4950 to 6465 or olderMedia habits change more with age than with anything else, so this is the first split to make.
-
How many people live in your home, including you?
12345 or moreTV and streaming are often shared. Household size helps explain paid services and viewing together.
-
Do any children under 13 live in your home?
YesNoChildren change what is on the TV and which services a home pays for.
What changes the numbers people give you
Media use is a habit, so people estimate rather than remember. Four design choices decide how close those estimates come to real behaviour.
Reported watching TV more than 2.5 hours a day
Choose time bands that do not lead
In a classic experiment, respondents estimated their daily TV time from one of two answer lists. With a list that topped out at "more than 2.5 hours", 16.2% placed themselves above that line. With a list that started at "up to 2.5 hours", 37.5% did.3 People read the middle of the list as normal. The core time question uses even two-hour bands from under 1 hour to 7 or more, so no band hints at the answer you expect.

Count days in a fixed week
Word scales blur. Pew Research Center found that "sometimes" covered anything from about one day a week to three or more.1 A count of days in the past 7 means the same thing to every respondent, codes straight into a number and still lets you report a share of frequent users.

Give examples for channels people mix up
When Pew added programme names to its question on national network TV news, the share saying they watched on five or more days fell from 35% to 28%. For public radio it fell from 15% to 10% once NPR was named.1 People fold cable news and apps into "network TV" unless you show them what you mean, so the news set names the networks.

Expect news to be overstated
Following the news feels like a civic duty, so people report the news habit they intend to have. One study found survey reports of network news viewing ran three times higher than ratings on average, and up to eight times higher for some groups.4 Pew found the same pattern: people who called following the news very important overestimated the most.2 Neutral wording, a dated week and "0" as the first option all help.
Curious which channel a class or audience would save? Show the keep-one question on a slide and let the room vote with a free online poll, then send the full survey. The page on making and sharing polls shows the link, QR code and embed options.
Days, hours or often: which answer format to use
Four kinds of frequency question turn up in media research. Each one suits a different job, so pick by what you need to report.
| Format | Best for | Watch out for |
|---|---|---|
| Days in the past 7 (0 to 7) | How regularly people use each channel, and counts you can average | Says nothing about minutes. Pair it with one time question. |
| Time on a typical day, in bands | Total media time and heavy versus light users | The bands you print steer the answers. Keep them even, with an open top band. |
| Hours and minutes, typed in | A precise figure for one channel, such as news | Slower to answer and full of round guesses like 2 hours. |
| Often, sometimes, rarely, never | A quick sense of habit in a short poll | "Sometimes" can mean once a week or most days. |
Pew Research Center matched the word scale against day counts: people who said "often" mostly meant five to seven days a week, "rarely" meant zero to two, and "sometimes" was spread widely.1 That is why the core uses days. The European Social Survey took the other route for its single news item, asking for hours and minutes on a typical day to avoid the pull of printed answer ranges.5 For more question types and when each one fits, see the marketing survey questions library.
Turn the answers into numbers you can analyse
Class projects and theses often need media use as a variable. Here is how each core answer codes, with a worked example.
| Question | Code it as | Level |
|---|---|---|
| Channels used (c1) | One yes or no column per channel; add them up for a channel count | Nominal, count 0 to 9 |
| Days per channel (c2 to c5) | The number chosen, 0 to 7 | Ratio: zero means none, and averages make sense |
| Time on a typical day (c6) | Band midpoints: 0.5, 2, 4, 6 and 8 hours | Ordinal; midpoints give an estimate you can treat as interval |
| Device, reason, keep one (c7 to c9) | Category labels; report the share for each | Nominal |
Worked example. Forty people answer the time question: 4 choose under 1 hour, 18 choose 1 to under 3, 12 choose 3 to under 5, 4 choose 5 to under 7 and 2 choose 7 or more. Multiply each count by its midpoint and add: 2 + 36 + 48 + 24 + 16 = 126 hours. Divide by 40 for an estimated mean of about 3.2 hours a day. The median person, the 20th and 21st in order, sits in the 1 to under 3 band, so most of the group is lighter than the mean suggests. Report both.
For the day counts, report the share who used a channel on five or more days as frequent users. That line matches what most people mean by "often", so your figures stay comparable with surveys that use the word scale.1 Splitting by age is usually the most telling cross-tab.
For a class, a focus group or a library desk
Hand it round a class, a focus group or a library desk. Letter or A4 both work, with tick boxes and ruled lines for the open answer.
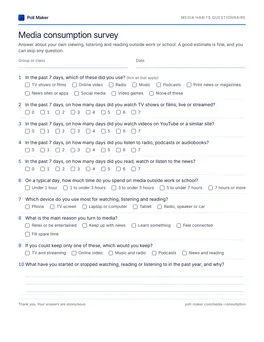
Media habits questionnaire
The ten core questions fit on page one, day counts included. TV, audio, news, ads and About you follow on the next pages, so print only the sheets you need.
Download PDFFour media questions to fix before you send
These four slip into class projects and audience surveys all the time. For question types beyond media, the survey questions hub has examples of every format.
How often do you watch TV? (Often / Sometimes / Rarely / Never)
In the past 7 days, on how many days did you watch TV shows or films, live or streamed? (0 to 7)
The word scale means different amounts to different people. A day count is exact, and it averages.
How much TV do you watch a day? (Up to 30 min / 30 to 60 min / 1 to 2 hours / Over 2 hours)
On a typical day, how much time do you spend on media outside work or school? (Under 1 hour up to 7 hours or more)
A top band of two hours tells heavy viewers they are unusual, and they answer lower. Even, wide bands leave room for everyone.
Do you get news from network TV?
Do you get news from national network TV, such as the ABC, CBS or NBC evening news?
Without examples many people count cable channels and news apps, and the share comes out too high.
What types of media do you consume?
In the past 7 days, which of these did you use? (tick list of channels)
"Consume" is research language, and with no time frame people answer for their habits in general rather than for a real week.
Questions people ask before measuring media habits
Short answers for students, researchers and marketers writing their first media questionnaire.
What questions should a media consumption survey include?
Which channels people used in a set week, on how many days, roughly how much time a day, on which device and for what reason. Add one open question about what has changed. The core 10 above covers each of these; add a set for TV, audio, news or ads when your project needs depth.
What are 10 good survey questions about media?
The core 10 on this page: a channel tick list, four day counts (TV and films, online video, spoken audio, news), daily time, main device, main reason, the one channel you would keep, and a free-text question about what changed this year.
How do you measure media consumption in a survey?
Ask for days in the past 7 per channel and time on a typical day in even bands. For precision on a single channel, ask for hours and minutes. Diaries and tracking apps give more exact figures but cost more effort, so most surveys use counts and bands.
Is a media consumption survey quantitative or qualitative?
Mostly quantitative: day counts, time bands and ticked channels turn into numbers and percentages. The open question on what changed adds a qualitative strand you can code into themes.
How many people do I need for a media survey?
For a class project, a few dozen answers are enough to see the main patterns. To compare groups such as age bands, make sure every group you report has enough people to stand on its own. Share the link through more than one channel so heavy users of a single app do not dominate.
Send your media survey this week
Load the core 10 into the builder, pick one extra set if your project calls for it, then share it through email, a class page or your own channels. Print the questionnaire for anyone answering on paper.