Access to health care survey questions, plus a tally sheet for paper rounds
Good access questions ask whether people got care when they needed it, and what stood in the way: cost, travel, waits, opening hours, respect or not knowing where to go. Begin with twelve questions that suit any community or clinic, then add sets whose cost questions match the national health survey, so your numbers have a yardstick.
- 37questions
- 12in the core set
- 6dimensions of access
- 5 minto answer the core
By Michael Hodge, BSc Psychology Updated September 2026
Cost, travel, appointments, respect: the full question set
Cost, travel, waits, language, dental and mental health: every item lists the choices people tick and what a clinic or health department learns from the result. The first twelve arrive ticked; add the sets that fit your community, then take the selection into the builder, onto paper for outreach days, or into another tool as text.
The core 12: can people get care?12 questions
Where people go for care, whether they went without, the main reason, a statement for each of the six dimensions of access, an overall rating, minutes of travel and a single open question. On its own it shows where access breaks down.
-
Where do you usually go when you are sick and need health care?
Doctor's office or clinicUrgent careEmergency roomSomewhere elseNo usual placeA usual place of care is the base of access. The national survey does not count the emergency room as one: 88.6% of US adults had a usual place in 2024.6
-
In the past 12 months, did you go without health care you needed, or get it late?
NoYes, onceYes, more than onceNot sureThe headline number: the share who went without or waited too long, for any reason, in one fixed window.
-
If yes, what was the main reason?
CostNo appointment in timeToo far or no rideHours or time offOtherDoes not applyThe barrier tally. One main reason per person gives you a ranking you can act on, and tells you which optional set to add next time.
-
The kinds of care I need are offered in my area.
Strongly disagree12345Strongly agree1 = Strongly disagree, 5 = Strongly agreeAvailability: whether the right services exist nearby at all, before cost or travel come into it.
-
My usual place of care is within easy reach.
Strongly disagree12345Strongly agree1 = Strongly disagree, 5 = Strongly agreeAccessibility in the geographic sense. People judge the trip they make, by car or by bus, not the distance on a map.
-
I can get appointments at times that fit my life.
Strongly disagree12345Strongly agree1 = Strongly disagree, 5 = Strongly agreeAccommodation: hours, booking and phones. Low scores here are among the fastest barriers for a clinic to fix.
-
I can pay for care without going short on basics.
Strongly disagree12345Strongly agree1 = Strongly disagree, 5 = Strongly agreeAffordability asked as a trade-off, which catches people who pay for care by going short on food, rent or medicine.
-
Where I get care, people like me are respected.
Strongly disagree12345Strongly agree1 = Strongly disagree, 5 = Strongly agreeAcceptability. People stay away from care where they feel judged, even when it is close and cheap.
-
I know where to go when my usual place is closed.
Strongly disagree12345Strongly agree1 = Strongly disagree, 5 = Strongly agreeAwareness, the sixth dimension. Low scores send people to the emergency room for problems a walk-in clinic could handle.3
-
Overall, how easy or hard is it for you to get the health care you need?
Very hardFairly hardNeitherFairly easyVery easyOne summary rating to track from year to year. Read it next to the six statements to see which one drags it down.
-
About how many minutes is the trip to the place you usually go for care?
Under 15 min15 to 29 min30 to 59 min1 hour or moreNo usual placeTravel time in bands, which people can estimate. Split every other answer by it to see where distance starts to cost you patients.
-
What one change would make it easier for you to get the care you need?
Open answerOne change in the person's own words. The answers group into a few themes, and often name a fix nobody had thought of.
Cost and coverage5 questions
Two of these keep the exact wording of the National Health Interview Survey, so your percentages can sit next to national figures. Keep the form anonymous: money is where people most often understate.
-
What kind of health coverage do you have now?
Through a jobMedicareMedicaid or a state planBought on my ownNo coverageOther or not sureThe split that explains most cost answers. Nationally, uninsured adults under 65 went without needed care because of cost more than three times as often as privately insured adults.6
-
During the past 12 months, have you delayed getting medical care because of the cost?
YesNoNot sureNational survey wording, word for word. In 2024, 8.6% of US adults said yes.6
-
During the past 12 months, was there any time when you needed medical care, but did not get it because of the cost?
YesNoNot sureNational survey wording again, one step worse than a delay. In 2024, 7.4% of US adults said yes.6
-
In the past 12 months, did you skip doses, take less, or put off filling a prescription to save money?
YesNoI take no prescriptionsNot sureRationing medicine is access failing after the visit. The national survey asks this as three questions; 7.8% of adults answered yes to at least one in 2024.6
-
Before a visit, I can find out what it will cost me.
Strongly disagree12345Strongly agree1 = Strongly disagree, 5 = Strongly agreePrice you cannot see in advance keeps people away as surely as a high price. A low score points at how bills and estimates are explained.
Getting there4 questions
For rural areas, older residents and anyone without a car. Travel is a barrier people rarely raise unless the form asks about it.
-
How do you usually get to health care visits?
Drive myselfSomeone drives meBus or trainWalk or bikeTaxi or ride appOtherTells you who depends on other people or on transit, the groups most likely to miss visits when a ride falls through.
-
In the past 12 months, did you miss or put off a health visit because you had no way to get there?
NoYes, onceYes, more than onceA count of trips lost to transport. Nationally, people below the poverty line and Medicaid recipients report this barrier more often.7
-
During the past 12 months, have you had a visit with a doctor, nurse or other health professional by video or phone?
Yes, by videoYes, by phoneBothNoShows how far remote visits already reach, and who still travels for everything.
-
If your clinic offered a video visit, what would get in the way?
NothingNo suitable devicePoor internetNo private spaceNot sure howI prefer in personTick all that applyBefore replacing trips with video, check that people can take the call. Each tick is a different fix: a loaner tablet, a phone option, a private room at a library.
Appointments, hours and waiting5 questions
For clinics and health centers deciding on opening hours, booking and same-day slots. Each question asks about a recent, specific moment rather than a general feeling.
-
The last time you asked for a routine appointment, how long until the first opening?
Within a week1 to 2 weeks3 to 4 weeksOver a monthDon't rememberThe wait for planned care, in bands people remember. Track the share waiting over a month.
-
The last time you were sick and wanted to be seen quickly, how soon were you seen?
Same dayNext day2 to 3 days4 days or moreWent elsewhereUrgent access is where people give up and head to the emergency room. "Went elsewhere" counts them.
-
In the past 12 months, did you go to an emergency room because you could not get care anywhere else in time?
NoYes, onceYes, more than onceSeparates emergency room visits caused by gaps in access from true emergencies, which a plain count of visits cannot do.
-
When I call or message my usual place of care, I hear back the same day.
Strongly disagree12345Strongly agree1 = Strongly disagree, 5 = Strongly agreeThe phone line is the front door. Slow replies turn a quick question into a visit, or into no care at all.
-
Which of these would make getting an appointment easier for you?
Evening hoursWeekend hoursOnline bookingWalk-in timesVideo visitsText remindersTick all that applyPlanning data from the people you want to reach. Pick the one or two changes most people tick.
Being heard and understood4 questions
For communities where language, culture or past treatment keep people away even when care is close and affordable.
-
What language do you prefer for talking with a doctor or nurse?
EnglishSpanishAnother languagePrefer not to sayTells you which languages the next survey, the signs and the phone line need. Replace the options with the languages spoken locally.
-
When you needed an interpreter, how often did you get one?
AlwaysUsuallySometimesNeverHave not needed oneA direct check on interpreter services, asked only of those who needed one.
-
My health care providers explain things in words I understand.
Strongly disagree12345Strongly agree1 = Strongly disagree, 5 = Strongly agreeCare people cannot follow is care they cannot use. A low score often explains missed follow-ups and unfilled prescriptions.
-
How often have you felt judged or treated unfairly when getting care?
NeverRarelySometimesOftenAlwaysAsked as frequency so any answer above "never" is visible. Split it by age, language and coverage to see who feels it.
Dental, mental health and other care4 questions
Dental, mental health and eye care are often the first things people go without. Ask about them apart from medical care, or the gaps stay hidden.
-
In the past 12 months, which of these did you need but go without?
Dental careMental health careEye care or glassesA specialistPrescription medicineNone of theseTick all that applyOne question that ranks the kinds of care people miss most, so you know where to look next.
-
During the past 12 months, was there any time when you needed counseling or therapy from a mental health professional, but did not get it because of the cost?
YesNoNot sureNational survey wording. In 2024, 5.9% of US adults said yes, and 10.0% of adults aged 18 to 34.6
-
About how long has it been since your last routine checkup?
Within the past year1 to 2 years2 to 5 yearsOver 5 yearsNeverPreventive care is the first thing to slip when access is hard. Long gaps flag people to invite for a checkup.
-
About how long has it been since you last saw a dentist?
Within the past year1 to 2 years2 to 5 yearsOver 5 yearsNeverDental care is often paid for separately from medical care, so its gaps are often bigger. Compare it with the checkup answer.
About you3 questions
The age bands match the national survey, so you can compare like with like. Keep reported groups large, so nobody can be identified from their answers about health or money.
-
How old are you?
18 to 3435 to 4950 to 6465 or olderPrefer not to sayAccess differs sharply by age: in 2024, 10.7% of adults aged 18 to 34 delayed care because of cost, against 2.6% of those 65 and over.6
-
Which best describes where you live?
A cityA suburbA small townA rural areaLets you read travel and availability answers by area, where rural and city barriers usually differ.
-
Do you have a disability or long-term condition that makes getting care harder?
YesNoPrefer not to sayNationally, adults with a disability delayed care over cost far more often than those without, 14.2% against 8.0% in 2024.6
How your numbers compare with the national survey
The US National Health Interview Survey asks adults several of these questions every year. When your wording and time frame match, the 2024 figures give you a yardstick.6
| Question on this page | Where it is | US adults, 2024 |
|---|---|---|
| Has a usual place of care (the emergency room does not count) | Core, first question | 88.6%6 |
| Delayed medical care because of the cost | Cost and coverage | 8.6%6 |
| Needed medical care but did not get it because of the cost | Cost and coverage | 7.4%6 |
| Skipped, cut back or delayed a prescription to save money | Cost and coverage | 7.8%6 |
| Went without mental health counseling or therapy because of the cost | Dental, mental health and other care | 5.9%6 |
Worked example: 240 answers from a mobile clinic and two community centers
Thirty-one people say they delayed medical care because of the cost. That is 31 divided by 240, or 12.9%, about one and a half times the national 8.6%.6 With 240 answers, 12.9% carries a margin of error of roughly 4 percentage points either way, so the gap is real. With only 60 answers the same result could not be told apart from the national figure.
Split by coverage before drawing a conclusion. In the national data, 25.0% of uninsured adults under 65 went without needed care because of cost, against 6.8% of adults with private insurance.6 A community with many uninsured adults will sit above the national figure for that reason alone, and the fix is enrollment help rather than a new clinic.
Reaching the people who struggle to reach care
An access survey can only report on the people it reaches. Four habits keep it honest.

Ask outside the waiting room too
A survey handed out at the clinic hears only from people who made it through the door. The ones who gave up on care, or never started, are at work, on the bus or at the food bank. Leave paper copies at community centers, libraries and pantries, send the link by text through partner groups, and offer to read the questions aloud by phone. Note where each form came from, so you can see which route found the hardest-to-reach answers.
Adults under 65 who went without needed medical care because of cost, 2024
Read every result by coverage, age and disability
Totals hide the people who have the hardest time getting care. In the 2024 National Health Interview Survey, 25.0% of uninsured adults under 65 needed medical care but went without it because of cost, against 6.8% of those with private insurance.6 Adults with a disability delayed care over cost more often too, 14.2% against 8.0%.6 Split your own answers by the coverage and About you questions before you read the totals.
Measure travel in minutes, not miles
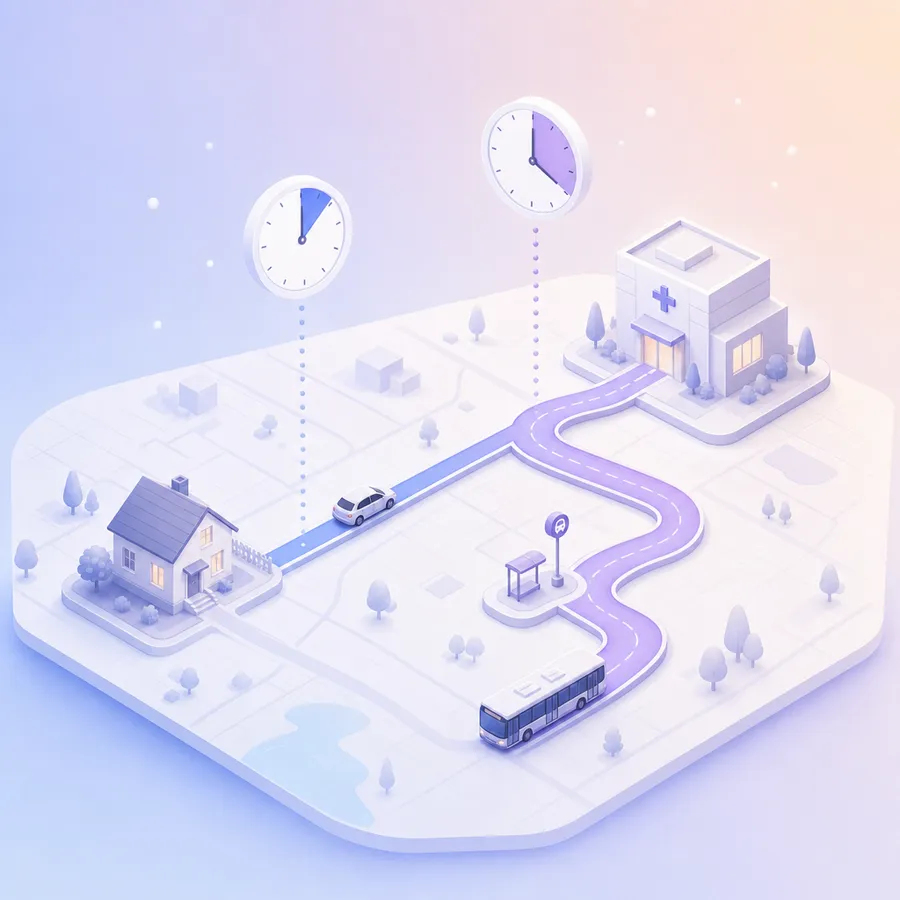
Ten miles by car and ten miles on two buses are different trips, which is why the core asks how long the journey takes and the travel set asks how people get there. In 2017, 5.8 million people in the United States, 1.8% of the population, delayed medical care because they had no transportation. People living below the poverty line, Medicaid recipients and people with a functional limitation were more likely to report it.7
Keep one window: the past 12 months
Memory blurs beyond a year, and a year covers every season, from flu winters to summer closures. The went-without, cost, travel and mental health questions here all use the same 12-month window as the national survey,8 so one year's results line up with the next and with the national figures.
Running a table at a health fair or a community meeting? Project the overall ease question as a live access poll, and everyone at the table can answer from a phone while you talk through the spread. The poll how-to shows how to share one over WhatsApp or email and close it on a schedule.
Six dimensions of access, and the core statement for each
Most access research builds on Penchansky and Thomas, who described access as the fit between people and the health system, across five dimensions.2 Saurman later argued for a sixth, awareness.3
| Dimension | What it means to the person answering | Core statement | Go deeper with |
|---|---|---|---|
| Availability | The kinds of care they need exist nearby | The kinds of care I need are offered in my area. | Dental, mental health and other care |
| Accessibility | They can reach care in a reasonable time | My usual place of care is within easy reach. | Getting there |
| Accommodation | Hours, booking and phones fit their life | I can get appointments at times that fit my life. | Appointments, hours and waiting |
| Affordability | Cost does not stop or delay care | I can pay for care without going short on basics. | Cost and coverage |
| Acceptability | They feel respected and comfortable | Where I get care, people like me are respected. | Being heard and understood |
| Awareness | They know what exists and where to go | I know where to go when my usual place is closed. | Being heard and understood |
Levesque and colleagues offer a second lens: five dimensions of services, each matched by an ability people need, to perceive a need, seek care, reach it, pay for it and engage with it.4 A scoping review of 31 studies that used their framework collected 147 distinct access questions, and 73% of them were written for patients to answer.5 Asking people about their own experience, as every question here does, is the usual route.
Looking for the perceived access to health care questionnaire?
The Perceived Access to Health Care Questionnaire (PAHCQ) measures the same six dimensions in 30 statements, each answered on five points from agree to disagree. Its authors tested it with 276 adults at two health centers in Tehran, and it held together well: Cronbach's alpha was 0.86 for the whole scale and test-retest agreement 0.94.1 The full item list is in the paper's technical appendix, published open access. Cite the paper if you use it; the statements on this page are our own and do not repeat its items.
Turn the six statements into an access profile
Key in the count for every answer point on the six dimension statements. The chart ranks the dimensions from strongest to weakest, flags the weakest as the barrier to tackle first, and prints on one page.
- 1For every statement, total the forms by answer point; the 4s and 5s together are the agreeing share.
- 2Start with the lowest dimension. If affordability is lowest, add the cost set next round; if accommodation, add the appointments set.
- 3Put the main-reason tally beside the chart. The two usually point at the same barrier; when they do not, the open answers explain why.
- 4Tell the people who answered what you found and the first change, using the same places the survey went out.
Access profile
Access questions that mislead, and what to ask instead
The same fixes work in any health survey. Our guide to survey questions walks through each question type.
Do you have good access to health care?
In the past 12 months, did you go without health care you needed, or get it late?
If yes, what was the main reason?
"Good access" is read differently by every respondent. A specific event in a fixed window, plus its cause, gives you a number and a direction.
Is health care affordable and close to where you live?
I can pay for care without going short on basics.
My usual place of care is within easy reach.
Two barriers in one question. Someone with a clinic next door that they cannot afford has no honest answer.
How far do you live from the nearest hospital?
About how many minutes is the trip to the place you usually go for care?
Most care happens outside hospitals, and miles ignore how people travel. Minutes to their own usual place is what they can answer and what you can act on.
Have you ever had trouble getting health care?
The last time you asked for a routine appointment, how long until the first opening?
"Ever" reaches back decades and "trouble" could mean anything. A recent, specific moment produces answers you can track year on year.
For the mobile clinic, the food bank and the senior lunch
Paper reaches the people an online link misses: at a mobile clinic, a food bank or a senior lunch. Each file prints on US letter and fits A4 as well.
Taking only the core to an outreach day?
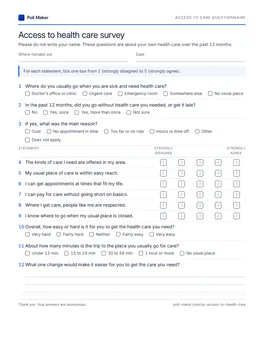
Access to care questionnaire
Page one is the core 12 with pencil boxes. Every optional set starts on a later sheet, so outreach teams carry only the pages they need.
Download PDF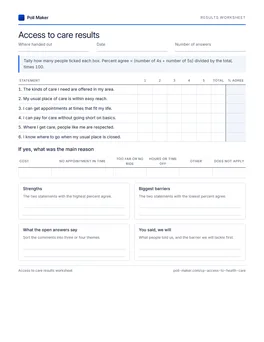
Results tally sheet
Count the six dimension statements, work out percent agree, tally the main reasons, and pick the barrier to tackle first.
Download PDFAlready surveying patients? Add these five on access
Already running a patient satisfaction survey? Add these five and it will also show who went without care, the main reason, and whether appointment times, cost and travel are working for your patients.
- 01In the past 12 months, did you go without health care you needed, or get it late?
- 02If yes, what was the main reason?
- 03I can get appointments at times that fit my life.
- 04I can pay for care without going short on basics.
- 05About how many minutes is the trip to the place you usually go for care?
For a class project or thesis on access to care
Access to care is a popular topic for public health, nursing and social work students. Three decisions shape how much your results can say.
Decide whose access you are measuring
Patients recruited inside a clinic have already reached care, so they can describe waits, hours and respect but not the people who never arrived. For access across a community, recruit in several places, such as a library, a transit stop and a food bank, and note how many people you approached as well as how many took part.
Open with a consent line
For example: "Your answers are anonymous and taking part is up to you. Skip any question, and stop at any point." Leave out names, dates of birth and diagnoses, and check what your ethics board or instructor requires before you collect anything.
Plan the analysis before you print
Report each question as a count and a percentage, then compare groups (insured and uninsured, city and rural) in two-way tables. The six core statements can be averaged into a 1 to 5 access score for each person, but report each dimension as well, since one score hides which barrier matters. If you need a validated scale, the PAHCQ described above is built for this.
Questions about measuring access to care
Short answers for clinic managers, health departments and students.
What questions should an access to health care survey ask?
Ask whether people went without care or got it late in the past 12 months and the main reason, then one question for each part of access: what services exist, travel, appointments and hours, cost, respect and knowing where to go. Round it off with where they usually go for care, their travel time and an open question about what would help.
What is the perceived access to health care questionnaire?
A 30-statement questionnaire published in BMC Health Services Research in 2021. It measures availability, accessibility, affordability, accommodation, acceptability and awareness, with answers from strongly agree to strongly disagree, and was tested with 276 adults at health centers in Tehran.1 Researchers use it when they need a validated scale.
How do you measure barriers to health care?
Count them in a fixed window and ask for the main one. Ask whether people went without or delayed care, then which barrier mattered most, then follow up that barrier with its own set of questions. Report each barrier as a share of everyone who answered, split by coverage, age and area.
How many people should answer?
Enough to compare the groups you care about. Around 100 answers give a margin of error near 10 percentage points on a yes or no question, and around 400 bring it close to 5. Each group you want to compare needs enough answers of its own.
Can I use these questions outside the United States?
Yes. Swap the coverage options for the ones in your country, such as a public scheme, private insurance or none, and keep the rest. The comparison figures on this page are for US adults, so compare with your own national health survey where one exists.
Who in your area is going without care?
Send the core 12 out through partner groups as an online survey, or take printed copies to your next outreach day.